

What it does
Analyze runs a deep, structured investigation into a question and returns a complete report. Where Ask is a quick conversation, Analyze plans out the work, runs it step by step against your data and Ontology, and writes up what it found, with key findings, the drivers behind them, supporting charts, and the data each fact came from. Use it when you want more than a quick answer: a thorough, repeatable analysis you can read, save, and share.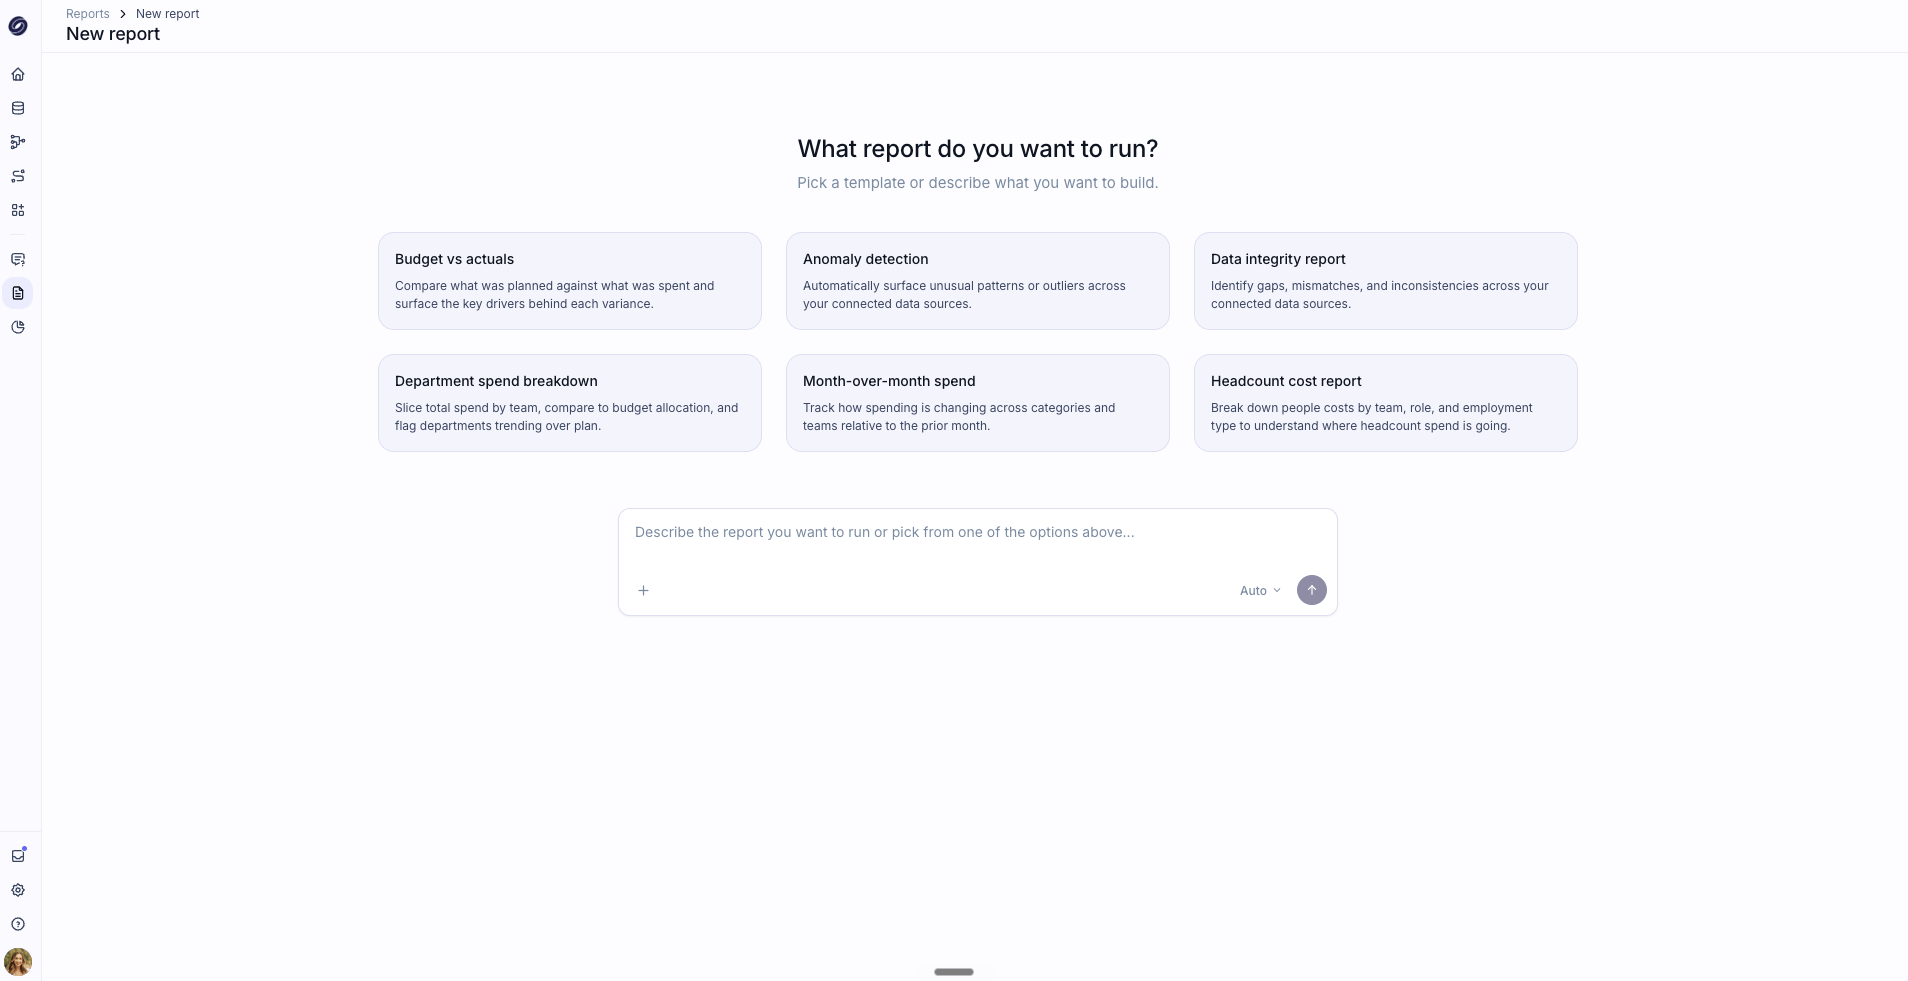
Choosing an analysis
Start a New Analysis by picking one of the built-in types or by typing your own question (for example “Why has profitability declined in Q4?”). The built-in types are:- Variance Analysis sees where performance diverged from plan and identifies the drivers behind the difference.
- Anomaly detection automatically surfaces unusual patterns or outliers in your data.
- Counterfactual path analysis helps you understand the impact of alternative scenarios by comparing what happened to what could have happened.
- Comparative analysis compares departments, locations, or regions and highlights differences in performance across your business.
- Cash runway analysis surfaces opportunities and risks in your cash inflow and outflow that may extend your runway.
- Sales pipeline analysis determines the health of your sales pipeline and its ability to support revenue forecasts.
How a run works
Answer a few questions
Pluvo asks some clarifying questions to understand exactly what you want, such as the period, the comparison, or the part of the business to focus on. Your answers shape the analysis.
Review the plan
Pluvo lays out a plan: the goal it understood and the steps it will take. You can review it, remove steps you do not need, and choose the report style before approving.
Watch it run
Once approved, Pluvo works through the plan, showing progress and surfacing insights as it goes. You can stop a run at any point.
Where your analyses live
Completed analyses are saved under your work area, where you can reopen, rename, and share them, and download the report. You can also set an analysis to run on a recurring schedule so a fresh version is ready when you need it.Analyze, Ask, and Models
- Analyze plans and runs a structured investigation, then produces a report on your current data.
- Ask answers quick questions conversationally.
- Models is where you build scenarios and test what-if changes. Analyze reports on what your data shows; it does not create scenarios.