- Actual - The amount actually recorded by your accounting software. Since this is a, measure of what actually happened, it is only available for past time periods.
- Forecast - The amount that was projected. This could be for future periods (what we think will happen) or for past periods (what we thought would happen)
- Variance - The difference between the forecast and the actuals.
actuals for past periods and forecasts for future periods.
Sparklines
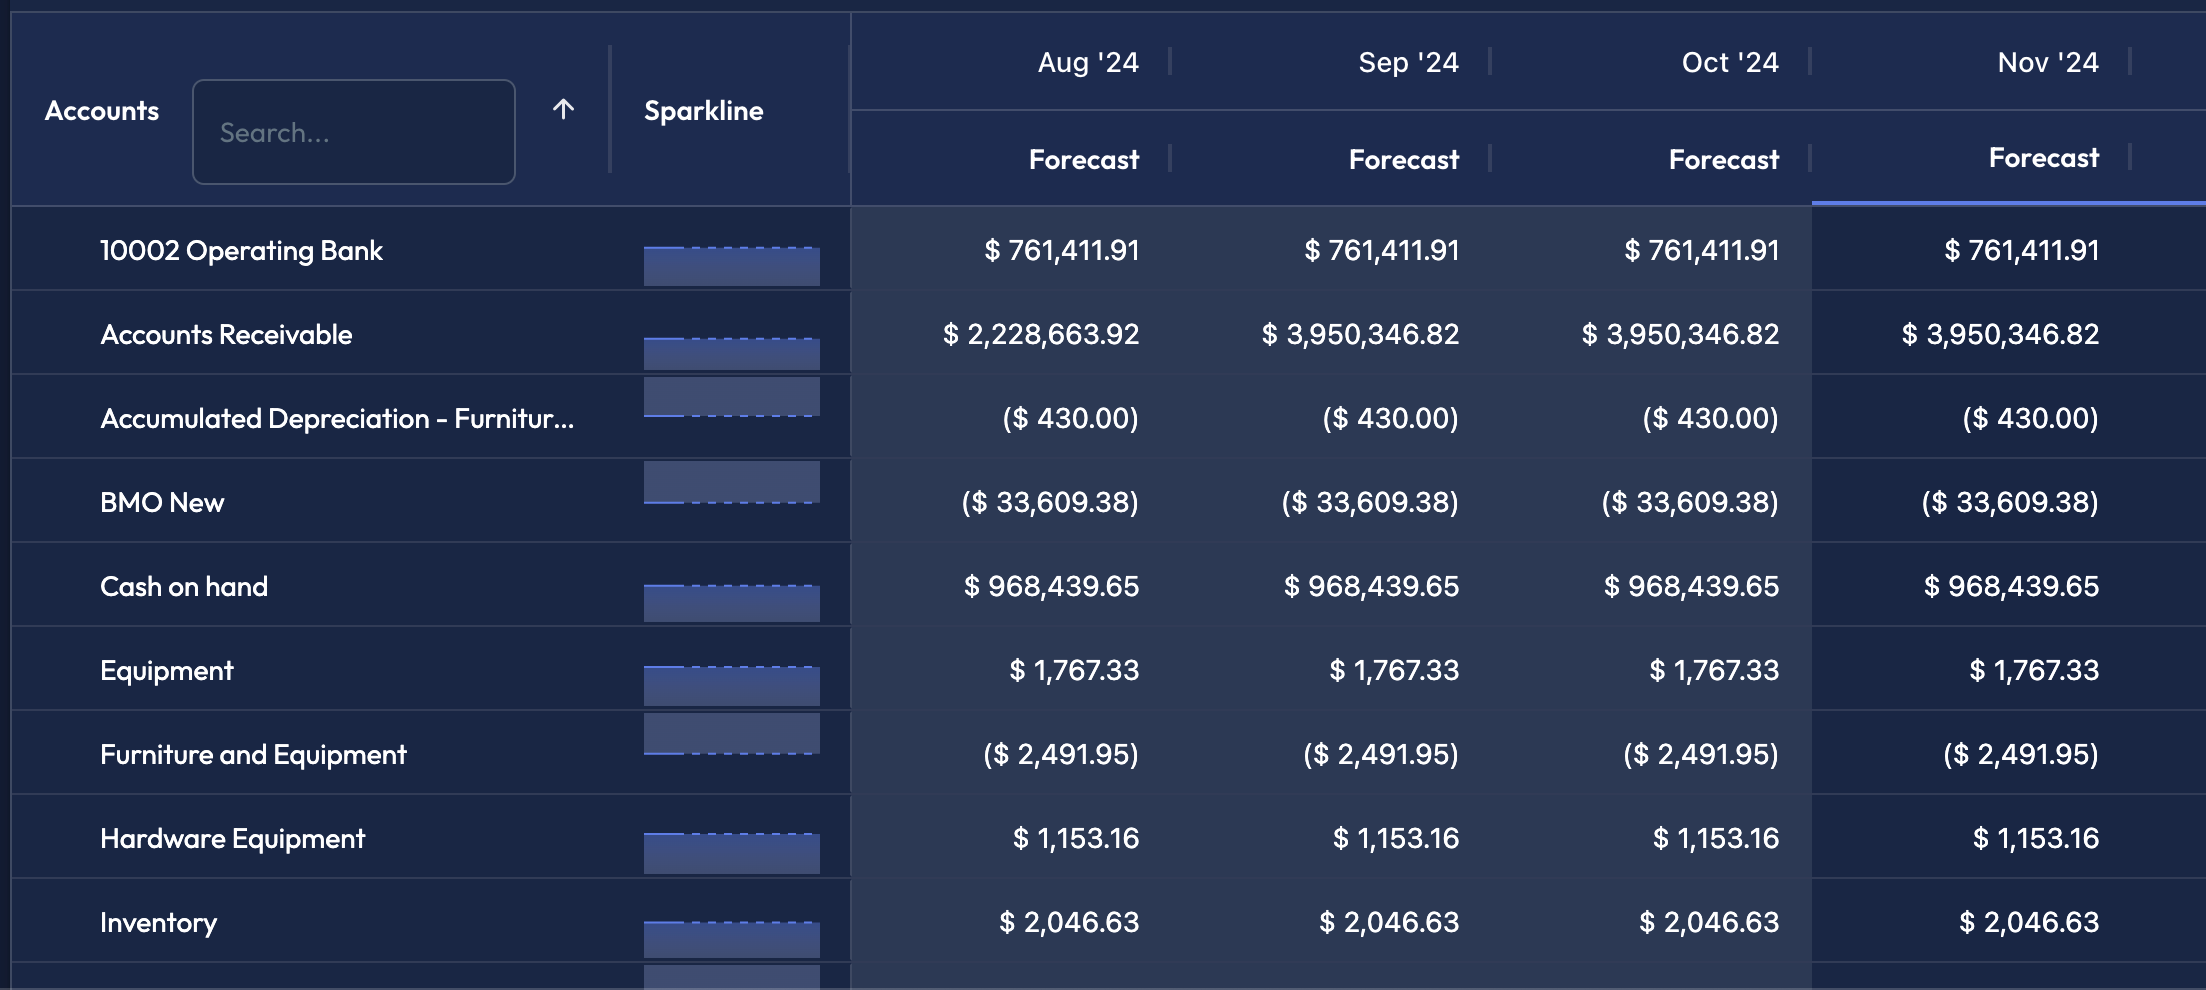
Sparklines throughout the app always display actuals in past months (solid line) and forecasts in future months (dotted line).View Past Actuals
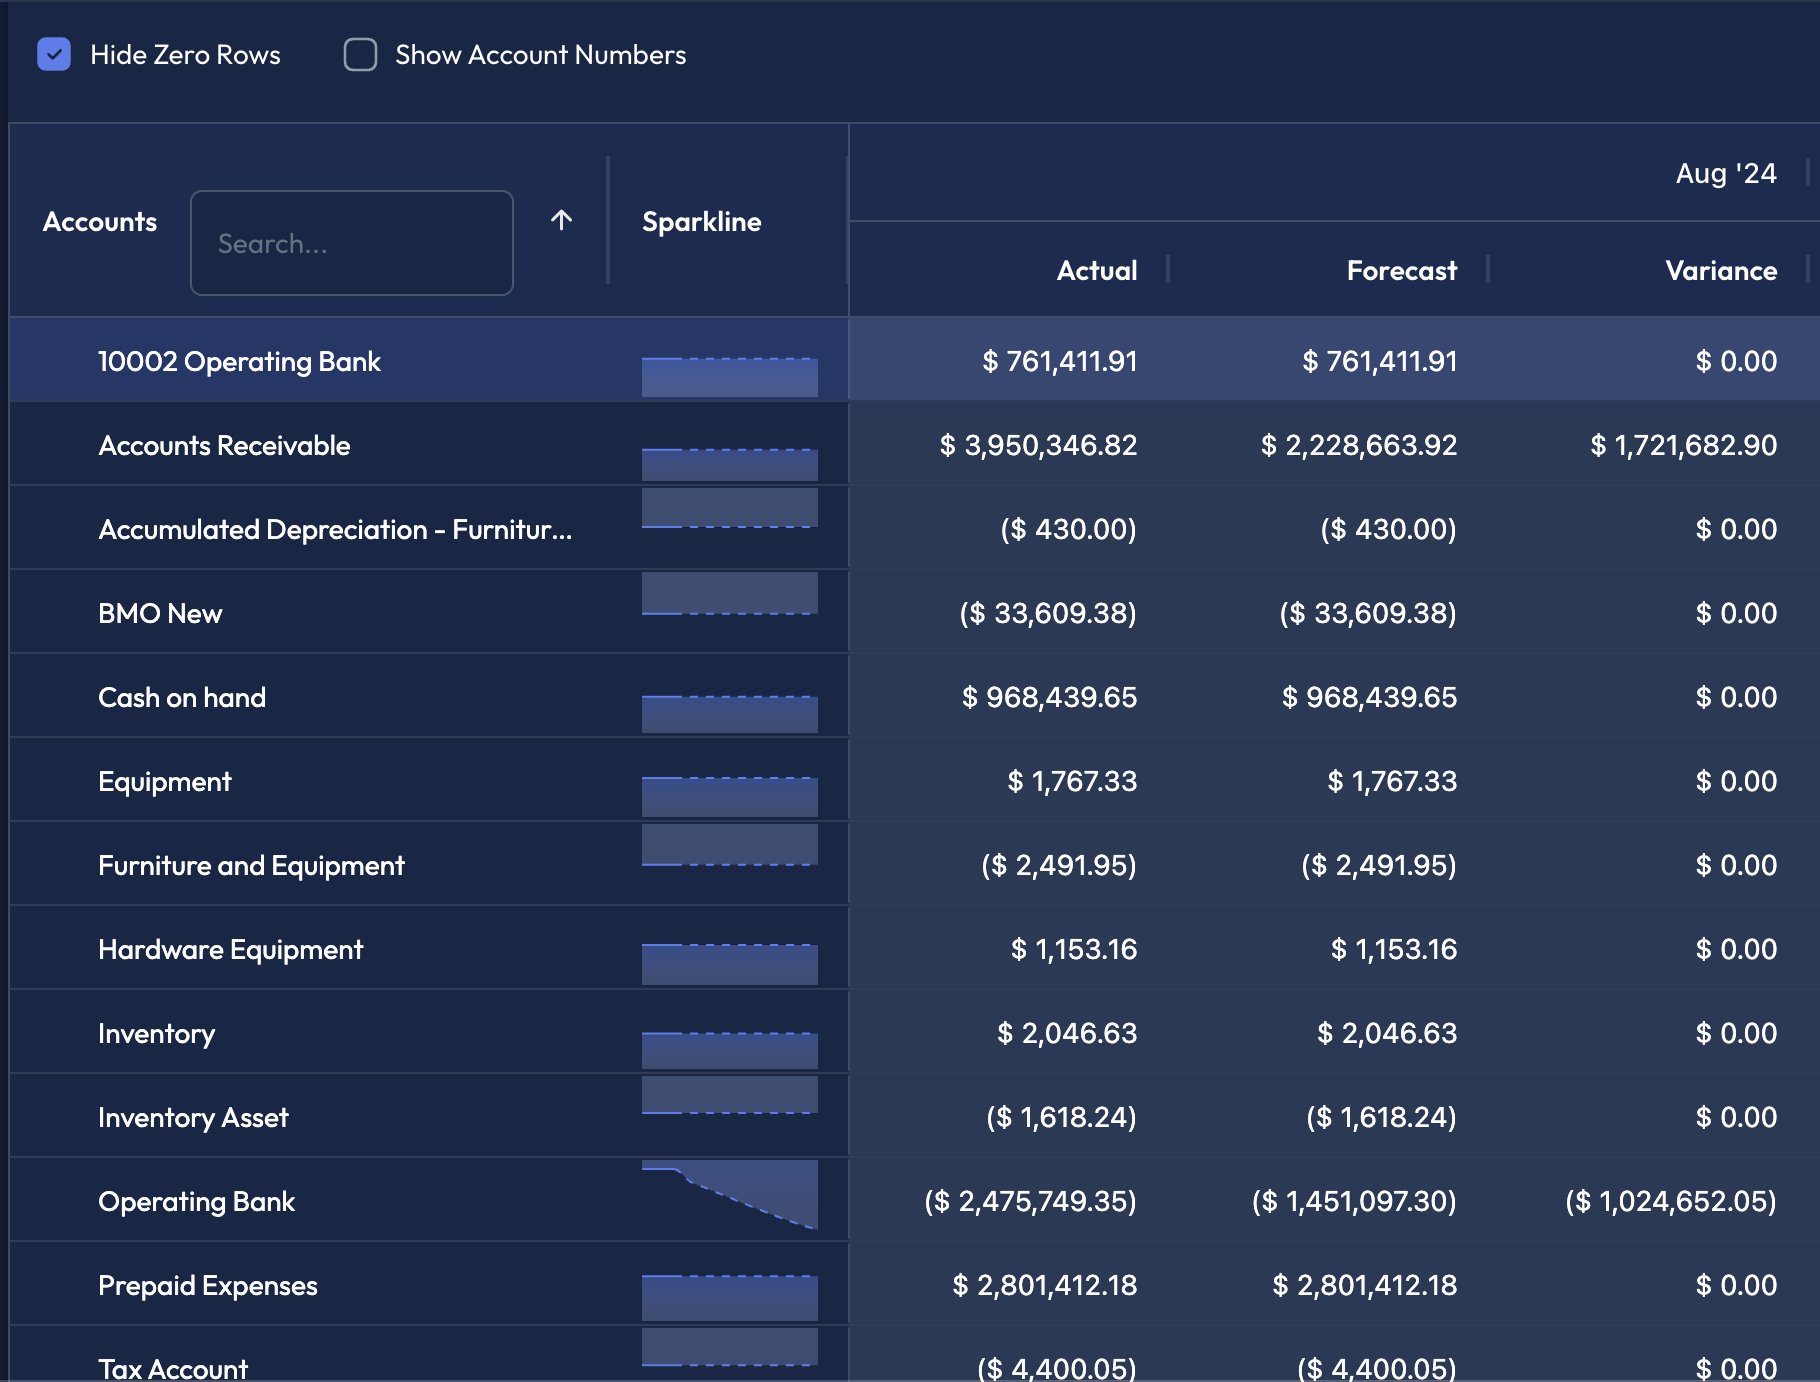
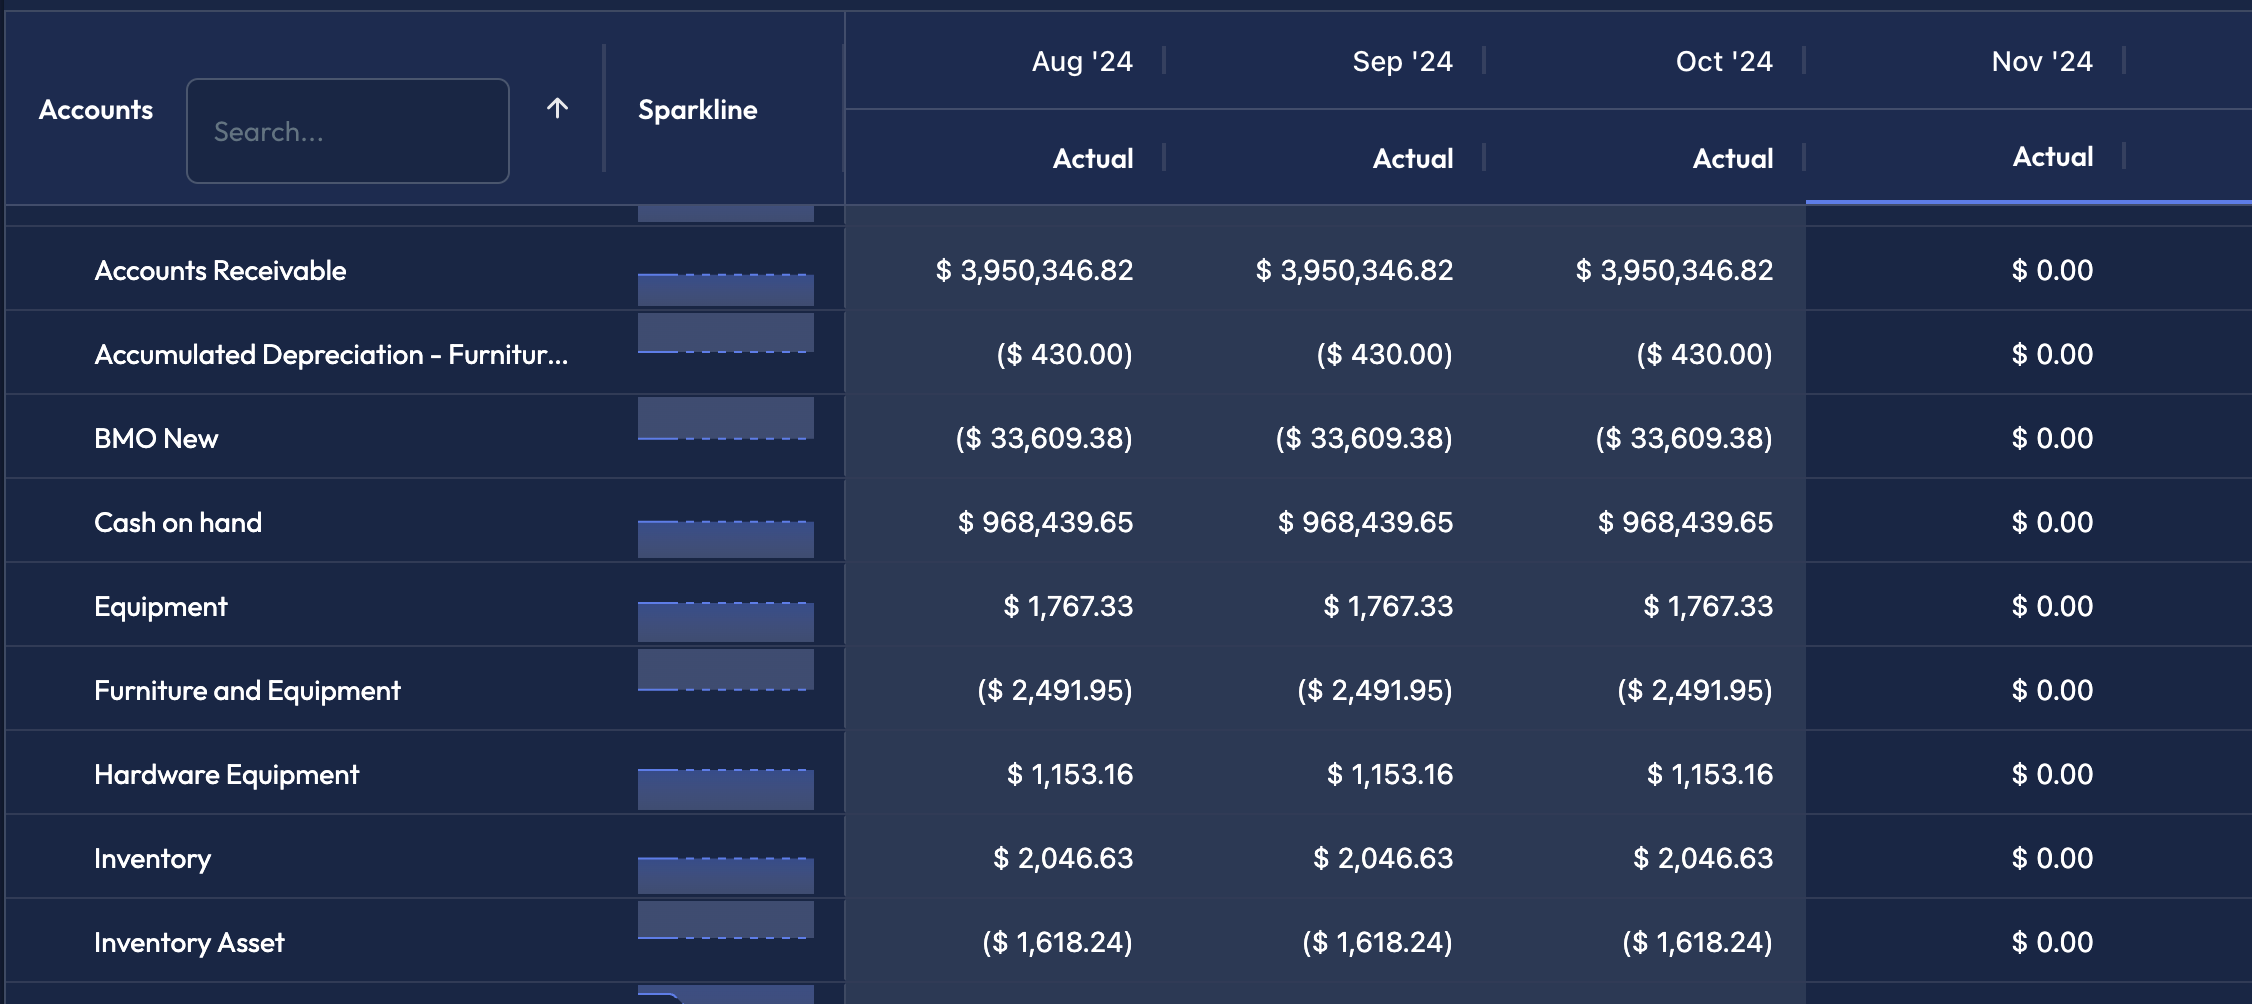
By Default, grids show actuals in all past periods.past periods are shaded in grids to make it easier to distinguish where actuals end and forecasts begin.
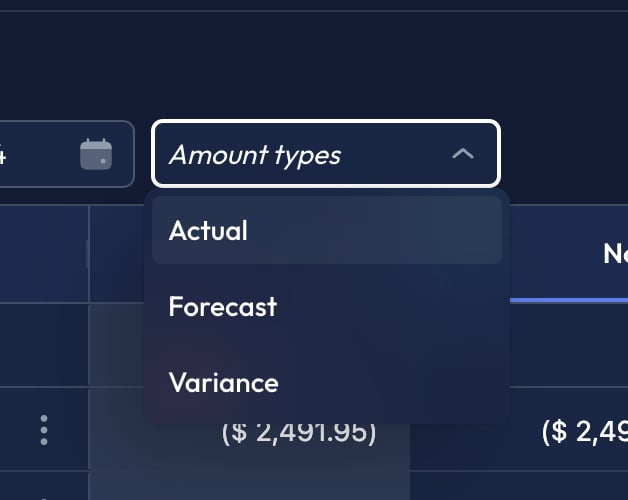
Actual from the amount type dropdown will add a label to the top of the column, confirming that you are looking at actuals. Note that actuals are only as up-to-date as your accounting software, and they are refreshed on data sync. You can refresh your data at anytime if you’d like to see make sure your actuals are up tp date (see: Refresh Integration Data).
View Past Forecasts
To view Forecasts in past months, ensureforecast is selected from the amount type dropdown.
View Past Variance
Similarly, you can view variance for past months by selectingvariance from the amount type drop down. This will display the difference between the forecasted amount and the actual amount. If the actual amount was LESS than the forecasted amount, the variance will be a negative number. Conversely, if the actual was LARGER than the forecasted amount, the variance will be positive.
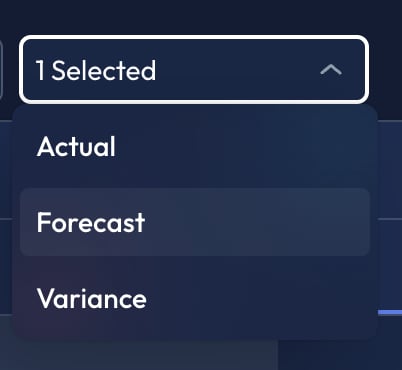
Combining Amount Types
You can also select multiple amount types at once. This allows you to see actual, forecast, and variance data in the grid at once. When multiple amount types are selected, each period column is split into multiple sections that display the different amount types.