
Documentation Index

Fetch the complete documentation index at: https://pluvo-02a06e95.mintlify.app/llms.txt

Use this file to discover all available pages before exploring further.

There are two main ways to look at forecast vs actuals in charts.
  1. By plotting both the forecast and actuals as separate series
  2. By plotting variance as its own series

Add

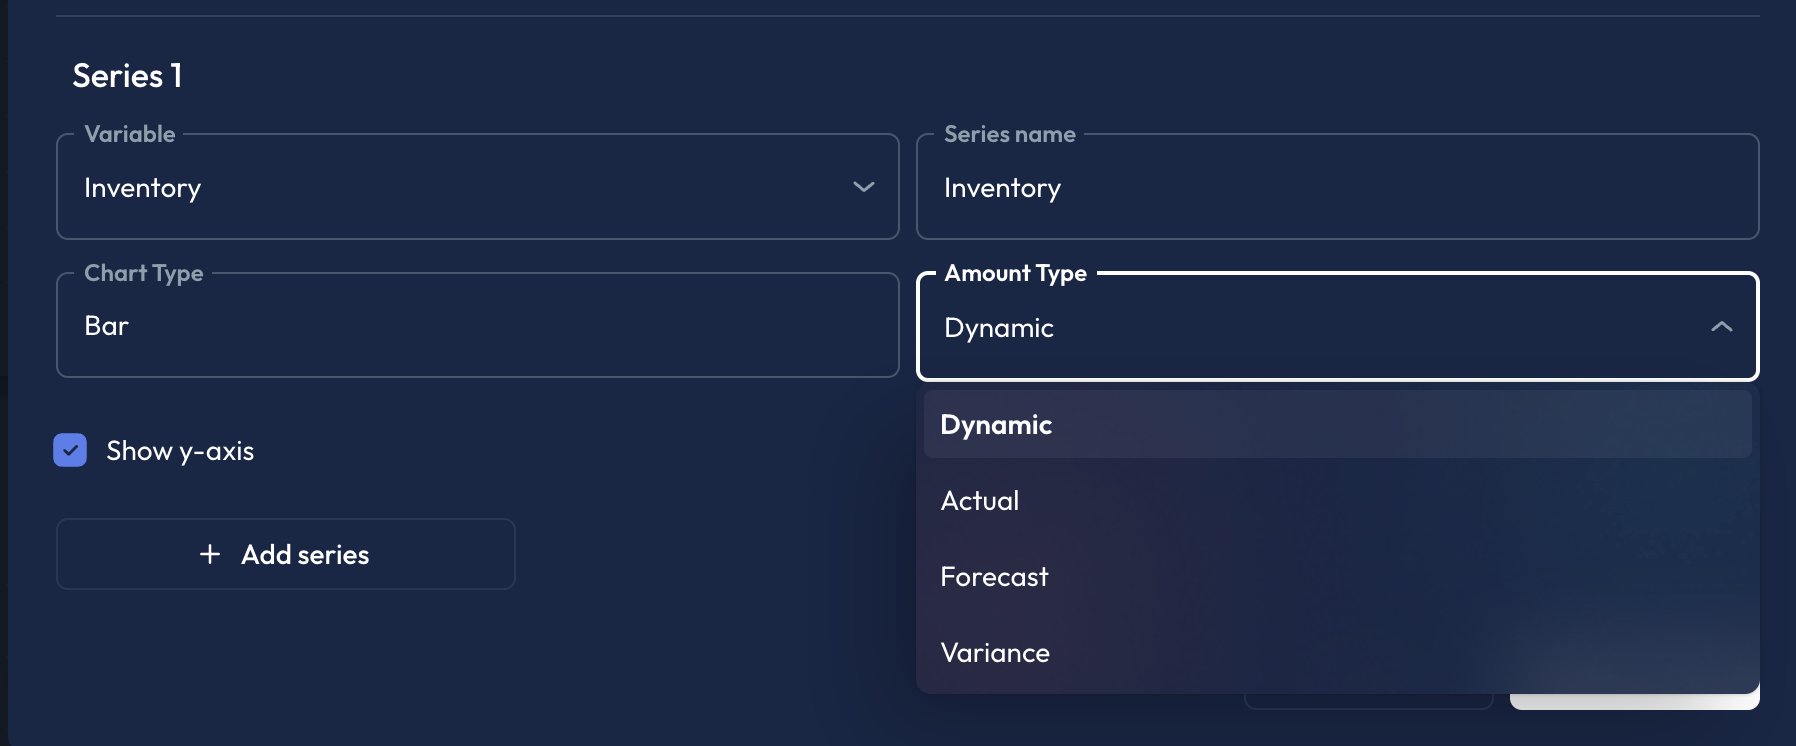
Forecast vs Actuals to a chart Forecasts and actuals can be added to charts as separate series to easily visualize the difference.
  1. Add a new Series
  2. Select your variable
  3. Under Amount Type, select Forecast
  4. Add a second series
  5. Select the same variable as in Step 2.
  6. Under Amount Type select Actual
  7. Click Save
Both series will now appear on the chart together.

Add Variance to a chart

Similarly, when adding a new series to a chart you can select variance as the amount type. This will series show the difference between the forecast and the actual amount.