

actual amount for past data (denoted by a solid line), and the forecast amount for future dates.
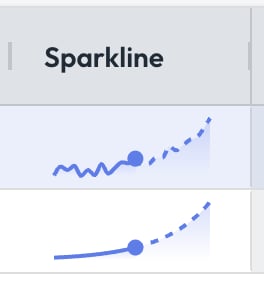
Sparklines are small charts that display in grids to help you quickly visualize how an amount is changing over time.
actual amount for past data (denoted by a solid line), and the forecast amount for future dates.