

What Is the P&L Used For?
The P&L helps you answer questions like:- How much are we making and spending each month?
- Are we profitable—or when will we be?
- How do our margins change as we scale?
Actuals vs.
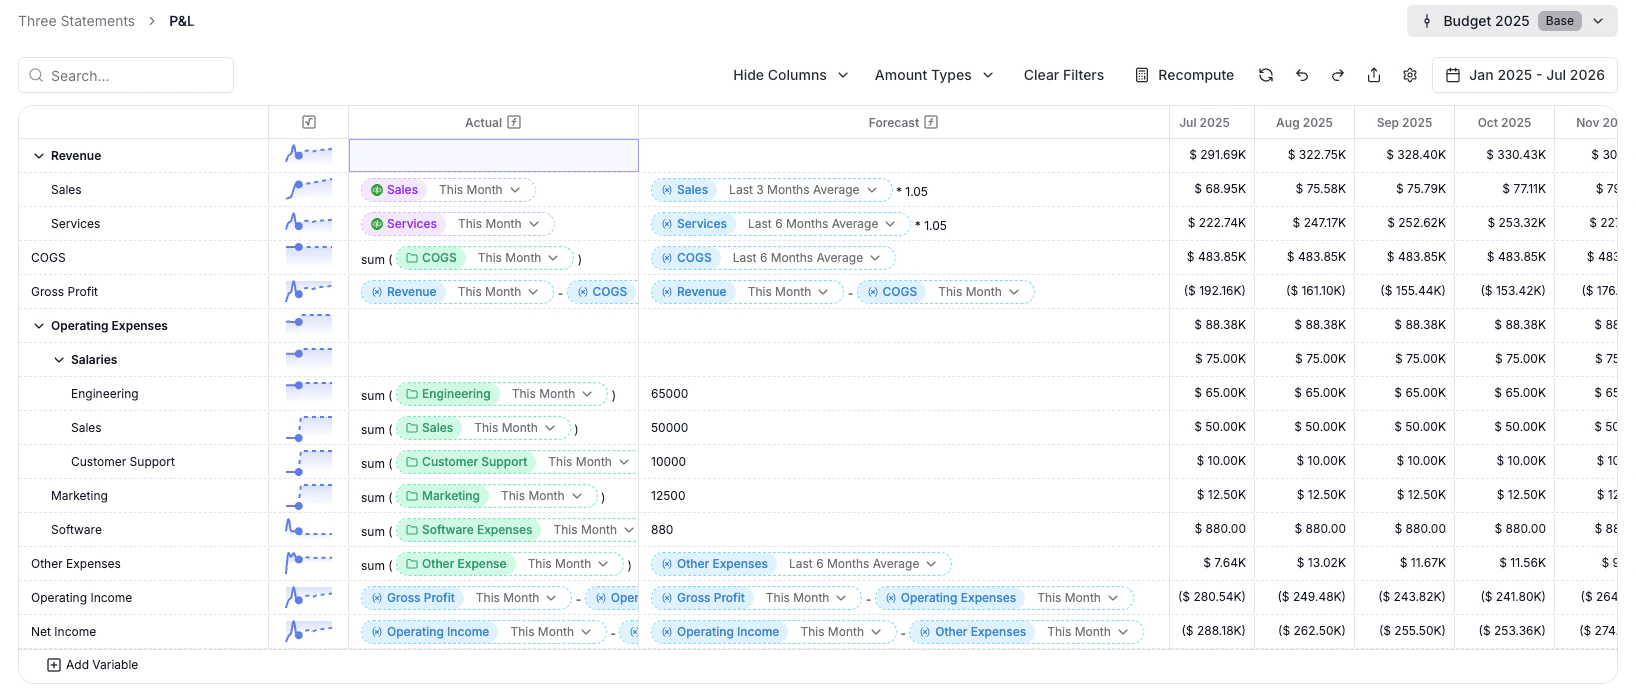
Forecasted P&L In Pluvo, your P&L model includes both actuals (historical data) and forecasts (forward-looking projections). Each variable has two sides: one for actuals, and one for forecasts—kept together in the same row so you can track performance over time in one place.Setting Up a P&L in Pluvo
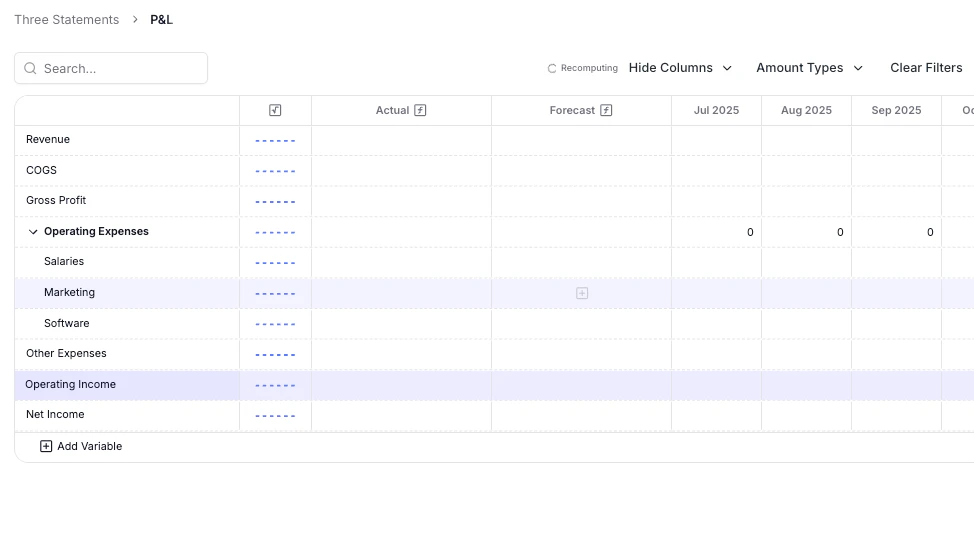
Step 1:
Create a New Model- In the sidebar, click + New Model
- Name it something like
P&LorIncome Statement - (Optional) Place it in a folder (e.g. “Core Statements”)
Step 2:
Add Core Variables Click + Add Variable and create key rows such as:- Revenue
- Cost of Goods Sold (COGS)
- Gross Profit
- Operating Expenses
- Salaries
- Marketing
- Software
- Other Expenses (Interest, Taxes, etc.)
- Operating Income
- Net Income (after interest, taxes, etc., depending on how detailed you need)
You can use folders to group related variables and keep your model organized.
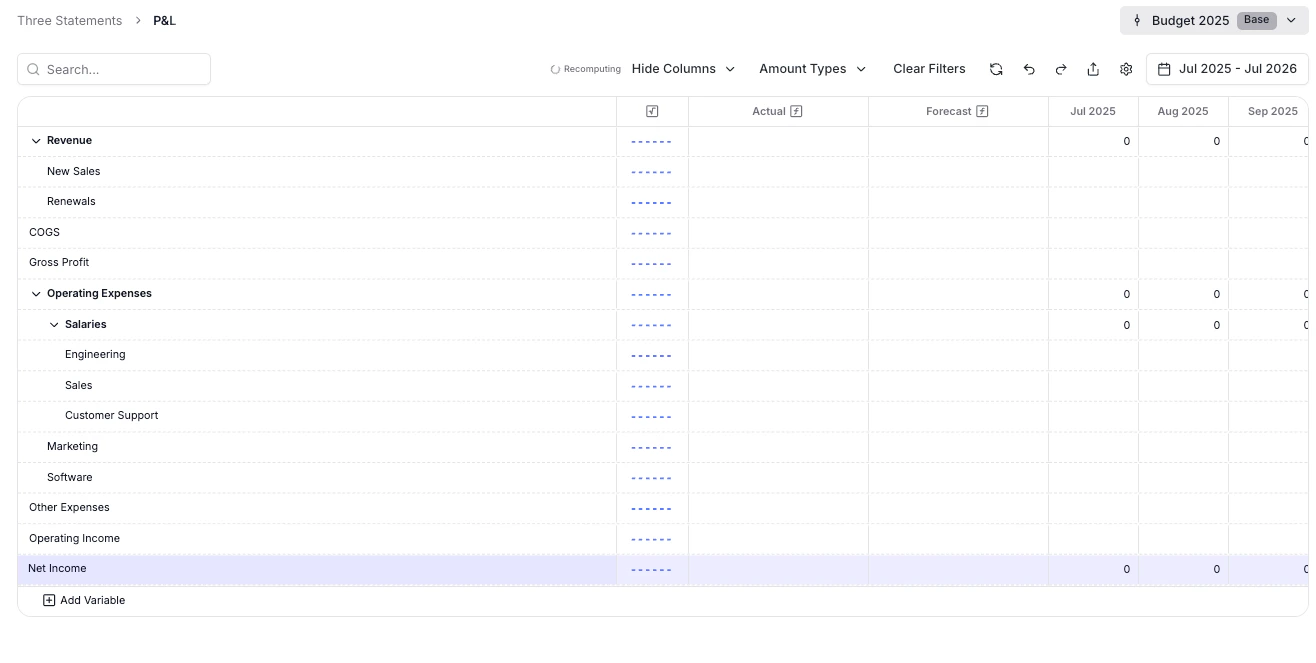
Step 3:
Add Detail You can break down any variable into sub-variables for more granularity. For example:- Revenue
- Sales
- Services
- Salaries
- Engineering
- Sales
- Customer Support
- Department
- Region
- Vendor
- Customer type
You can use dimensions in Pluvo to categorize data across any variable, then filter, roll up, or compare performance by those categories.
Step 4:
Define Actuals Each variable in Pluvo supports its own actuals definition. This tells Pluvo where to pull real data from. For your P&L, you’ll typically map actuals using your accounting software:- Click into the actuals definition for a variable
- Select the GL accounts to pull in (e.g. all income accounts for Revenue)
- Repeat for each line item (e.g. map
Payroll Expensesto Salaries)
- Gross Profit
(revenue - COGS) - Operating Income (
Gross Profit - Operating Expenses) - Net Income
(Operating Expenses - Other Expenses)
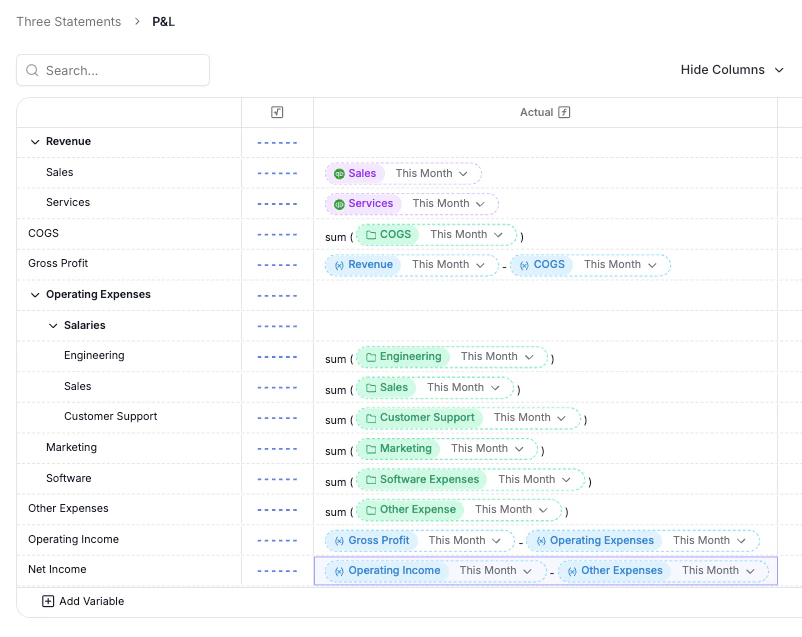
You can also define actuals using formulas or pasted data. This can be especially useful for metrics not tracked in your ERP (e.g. headcount, units sold, etc.)
Step 5:
Define Forecasts With actuals flowing in, you can now set up forecasts for each variable.- Click into the forecast definition column
- Add a static value, manual entry per month, or a dynamic formula
- e.g. `=headcount
- average_salary`
- or `=revenue
- 0.35` for a gross margin assumption
- In this example, we will be using using an average of the last 3 months, multiplied by a 5% growth rate every month for revenue and COGS accounts.
- Read more about forecasting on the formula and variables pages
Step 6:
Review & Iterate- Use sparklines to quickly visualize each row’s trend
- Toggle columns in the toolbar to focus on actuals, forecasts, or formulas
- Add scenarios to test different versions of your P&L (e.g. conservative, base, aggressive)
Think of your P&L model as the starting point for strategic planning. Keep it driver-based, link it to real data, and use it to align your team around the path forward.