> ## Documentation Index
> Fetch the complete documentation index at: https://docs.pluvo.io/llms.txt
> Use this file to discover all available pages before exploring further.
# Ontology
> See how Pluvo turns your raw data tables into a connected map of your business: accounts, invoices, contacts, and the relationships between them.
## What it does
The Ontology is Pluvo's map of your business. It takes the raw tables from your connected data sources and organizes them into meaningful business entities, such as accounts, invoices, contacts, and employees, and shows how they connect to one another.
This matters because the rest of Pluvo works from this map. When you ask a question or run an analysis, Pluvo reasons over these connected entities rather than guessing from raw tables, which is what keeps answers grounded in your actual data.
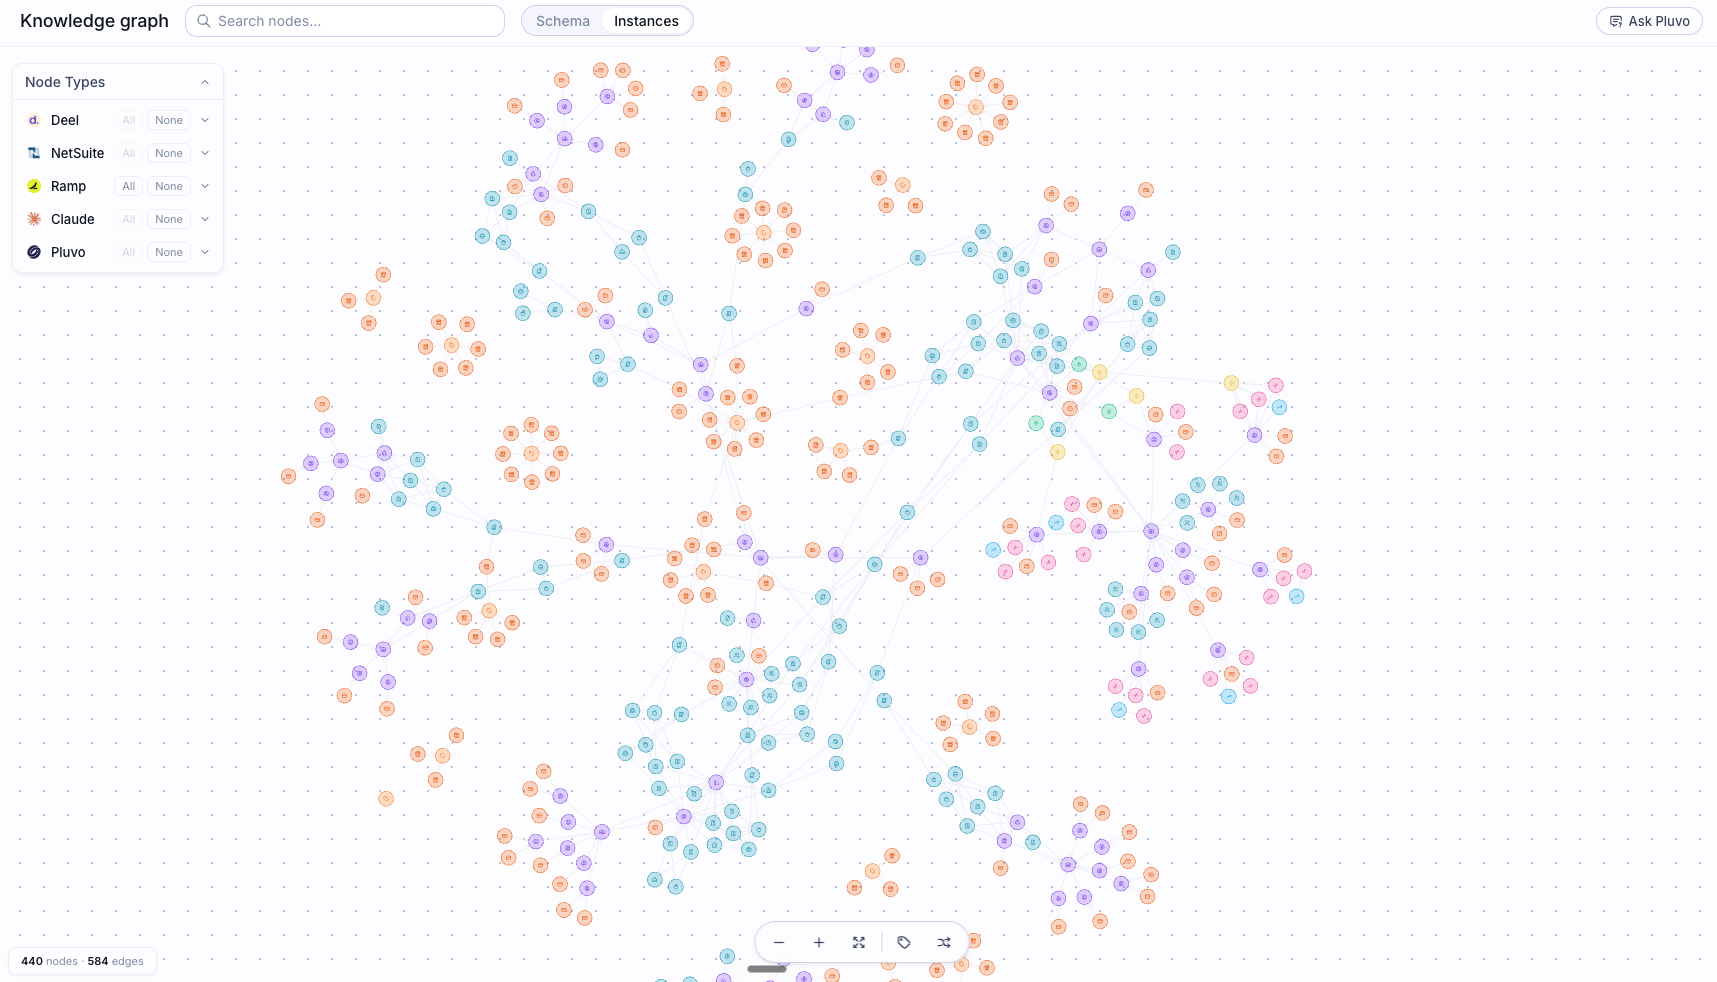 ## Getting around the page
**Connection selector.** At the top left, choose which connected source you want to view (for example "NetSuite data"). The badge near the top shows how many connections you have in total.
**Schema and Instances.** Toggle between two ways of looking at your data:
* **Schema** shows the structure: which entity types you have and how they relate. Think of it as the blueprint.
* **Instances** shows the real records flowing through that structure: individual accounts, invoices, and contacts, and the links between them.
**Search.** Use the search box to find specific entities by name or value. The graph filters to what matches.
**Node types.** On the right, you can see each entity type and how many of each exists, and filter the graph to show just one type. In the example, the graph holds 266 nodes, almost all of them Accounts.
## Reading the graph
The visual in the center is your business as a network:
* **Nodes** are the entities, shown as circles. In Schema view a node is an entity type; in Instances view a node is a single record.
* **Links** are the relationships between them, shown as connecting lines.
* The counter at the bottom (for example "Instances / 266 nodes / 479 links / 71%") tells you the view you are in, how many nodes and links are shown, and how much of the graph is currently visible.
The toolbar over the graph lets you zoom, fit everything to the screen, rearrange the layout, and show or hide labels. Click any node to open its details, including its properties and everything it connects to.
## The left panel
The panel on the left summarizes the selected connection:
* **Mapped connection** and its status (for example **READY**).
* **Tuples** and **Limit**: how many records are shown and the cap on how many load at once (1000 by default), which keeps large graphs fast.
* **Tables**: how many source tables are included in this mapping.
* **Published** and **Release**: when the current version of the Ontology was last published and its version identifier. Each time the mapping is updated and published, a new release is created.
* A list of the source tables with their row counts (for example "accounts, 6384 rows").
If a graph shows a "truncated" notice, you are seeing a capped sample for performance, not your full dataset. Use search and the node type filter to focus on what you need.
## How the map gets built
In **Data**, you connect a system and choose which tables to bring in.
Pluvo maps those tables to business entities, so an `accounts` table becomes the Account entity, for example. You can review and adjust this from **Data settings**.
Publishing turns the mapping into a usable version of your Ontology. Once it shows **READY**, the Instances view is live and the rest of Pluvo can use it.
## Tips
Start in **Schema** to confirm your entities and relationships look right, then switch to **Instances** to explore the real records.
Use the **Data settings** button to add sources, adjust how tables map to entities, and publish a new release when your data changes.
## Getting around the page
**Connection selector.** At the top left, choose which connected source you want to view (for example "NetSuite data"). The badge near the top shows how many connections you have in total.
**Schema and Instances.** Toggle between two ways of looking at your data:
* **Schema** shows the structure: which entity types you have and how they relate. Think of it as the blueprint.
* **Instances** shows the real records flowing through that structure: individual accounts, invoices, and contacts, and the links between them.
**Search.** Use the search box to find specific entities by name or value. The graph filters to what matches.
**Node types.** On the right, you can see each entity type and how many of each exists, and filter the graph to show just one type. In the example, the graph holds 266 nodes, almost all of them Accounts.
## Reading the graph
The visual in the center is your business as a network:
* **Nodes** are the entities, shown as circles. In Schema view a node is an entity type; in Instances view a node is a single record.
* **Links** are the relationships between them, shown as connecting lines.
* The counter at the bottom (for example "Instances / 266 nodes / 479 links / 71%") tells you the view you are in, how many nodes and links are shown, and how much of the graph is currently visible.
The toolbar over the graph lets you zoom, fit everything to the screen, rearrange the layout, and show or hide labels. Click any node to open its details, including its properties and everything it connects to.
## The left panel
The panel on the left summarizes the selected connection:
* **Mapped connection** and its status (for example **READY**).
* **Tuples** and **Limit**: how many records are shown and the cap on how many load at once (1000 by default), which keeps large graphs fast.
* **Tables**: how many source tables are included in this mapping.
* **Published** and **Release**: when the current version of the Ontology was last published and its version identifier. Each time the mapping is updated and published, a new release is created.
* A list of the source tables with their row counts (for example "accounts, 6384 rows").
If a graph shows a "truncated" notice, you are seeing a capped sample for performance, not your full dataset. Use search and the node type filter to focus on what you need.
## How the map gets built
In **Data**, you connect a system and choose which tables to bring in.
Pluvo maps those tables to business entities, so an `accounts` table becomes the Account entity, for example. You can review and adjust this from **Data settings**.
Publishing turns the mapping into a usable version of your Ontology. Once it shows **READY**, the Instances view is live and the rest of Pluvo can use it.
## Tips
Start in **Schema** to confirm your entities and relationships look right, then switch to **Instances** to explore the real records.
Use the **Data settings** button to add sources, adjust how tables map to entities, and publish a new release when your data changes.