> ## Documentation Index
> Fetch the complete documentation index at: https://docs.pluvo.io/llms.txt
> Use this file to discover all available pages before exploring further.
# Grids
> We just released all new grids! Keep reading to learn your way around.
We just released all new grids! Keep reading to learn your way around.
The grid is the heart of model-building in Pluvo. It’s where your financial structure comes to life.
## What Is a Grid?
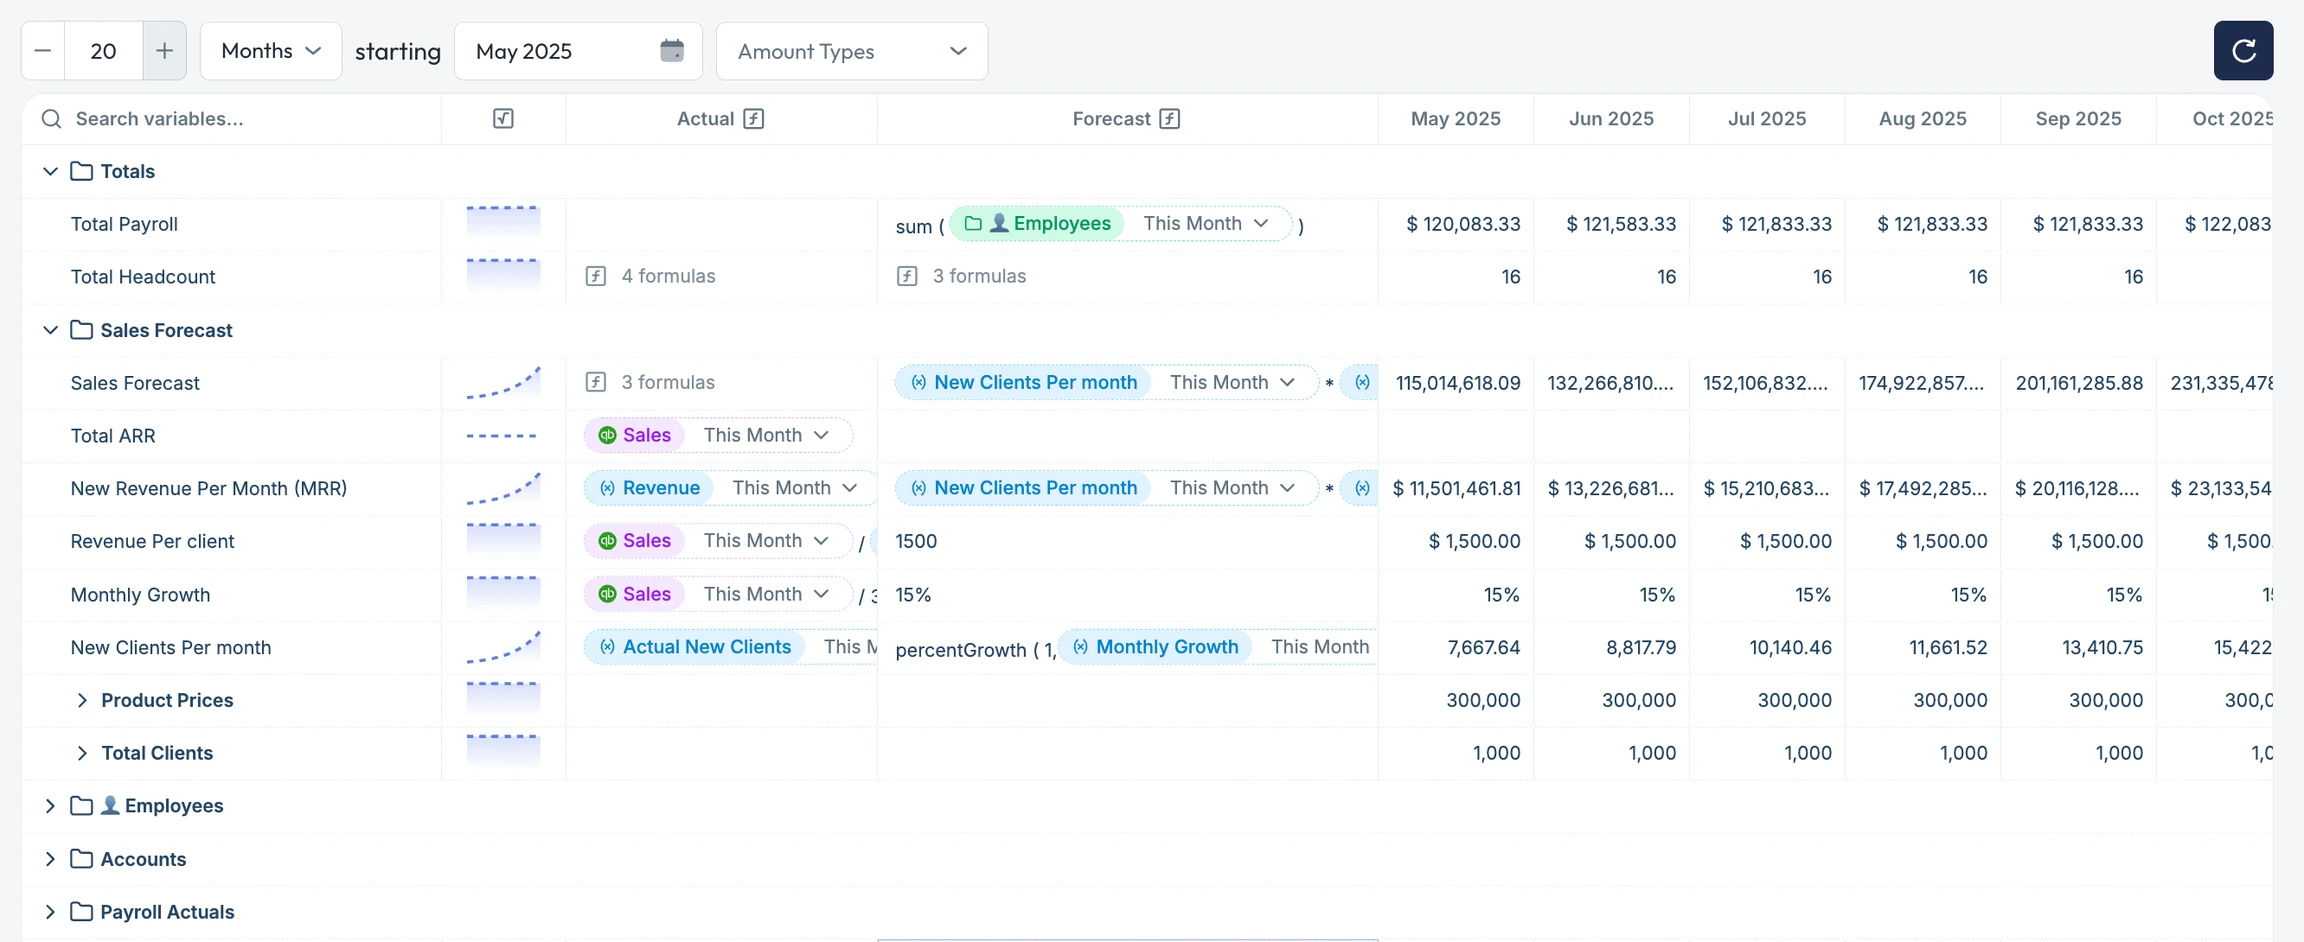
A **grid** is the working area inside a [model](/modelling/features/models), where each **row represents a** [**variable**](/modelling/features/variables) and each **column represents time** (typically months).
Variables are the building blocks of your financial plan. Each one contains:
* A **forecast definition**: your planned value or formula.
* An **actuals definition**: pulled from your accounting system.
* A series of **time-based values**, shown by month, quarter, or year.
 ### Key Elements
#### Rows = Variables
Each row in the grid is a **variable**. Variables can be:
* **Drivers** – inputs like headcount, unit cost, or conversion rate
* **Metrics** – outputs like revenue, gross margin, or runway
* **Accounts** – actuals pulled directly from your GL
You can nest variables, group them, or apply dimensions (*coming soon*) to get more granular.
You can reorder or regroup variables by simply clicking and dragging them.
Right-click in the grid header and select "expand all row groups" to open all folders and sub-variables at once.
#### Columns = Time
Columns show **time-based values** for each variable—typically broken down by month. The data in these time columns are referred to as *amounts.*
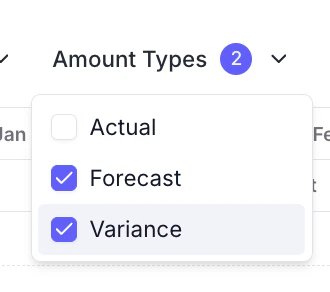
Using the `Amount Types` dropdown at the top of the grid, you can toggle between:
* Actuals
* Forecasts
* Variance (e.g., actual vs. forecast)
### Key Elements
#### Rows = Variables
Each row in the grid is a **variable**. Variables can be:
* **Drivers** – inputs like headcount, unit cost, or conversion rate
* **Metrics** – outputs like revenue, gross margin, or runway
* **Accounts** – actuals pulled directly from your GL
You can nest variables, group them, or apply dimensions (*coming soon*) to get more granular.
You can reorder or regroup variables by simply clicking and dragging them.
Right-click in the grid header and select "expand all row groups" to open all folders and sub-variables at once.
#### Columns = Time
Columns show **time-based values** for each variable—typically broken down by month. The data in these time columns are referred to as *amounts.*
Using the `Amount Types` dropdown at the top of the grid, you can toggle between:
* Actuals
* Forecasts
* Variance (e.g., actual vs. forecast)
 Use the `hide columns` drop down to hide/show specific columns.
Select `reset filter` to restore the default column layout.
#### ➕ Add Variables
Use the **“Add variable”** button to create a new driver, metric, or account row.
Each variable will have:
* A name and description
* A forecast definition
* An actuals definition
Read more about variable definitions on the [Variables](/modelling/features/variables) page.
#### Recalculate & Refresh
Pluvo recalculates models automatically when you update inputs or reload the page. You can click the refresh button in the top right to force the grid to reload.
### Best Practices
* Group related variables together (e.g., by department or cost center)
* Use dimensions to segment data without duplicating models *(coming soon)*
* Leverage sparklines for quick trend insights
* Keep forecast logic separate from actuals—Pluvo will compare them for you automatically
Want help structuring your first model or troubleshooting a formula? [Contact support](mailto:support@pluvo.io) or check out our Variables Guide.
Use the `hide columns` drop down to hide/show specific columns.
Select `reset filter` to restore the default column layout.
#### ➕ Add Variables
Use the **“Add variable”** button to create a new driver, metric, or account row.
Each variable will have:
* A name and description
* A forecast definition
* An actuals definition
Read more about variable definitions on the [Variables](/modelling/features/variables) page.
#### Recalculate & Refresh
Pluvo recalculates models automatically when you update inputs or reload the page. You can click the refresh button in the top right to force the grid to reload.
### Best Practices
* Group related variables together (e.g., by department or cost center)
* Use dimensions to segment data without duplicating models *(coming soon)*
* Leverage sparklines for quick trend insights
* Keep forecast logic separate from actuals—Pluvo will compare them for you automatically
Want help structuring your first model or troubleshooting a formula? [Contact support](mailto:support@pluvo.io) or check out our Variables Guide.