> ## Documentation Index
> Fetch the complete documentation index at: https://docs.pluvo.io/llms.txt
> Use this file to discover all available pages before exploring further.
# Ask
> Ask questions about your financial data in plain language and get grounded answers, with charts and tables, in a conversation.
## What it does
Ask is your conversational way into your data. You type a question in plain language, and Pluvo answers using your connected data and your Ontology, returning insights along with charts and tables right in the conversation.
Because Ask works from your Ontology and computes against your real numbers, answers stay grounded in your data rather than being made up. You can keep the conversation going, asking follow-ups and drilling deeper, and Pluvo remembers the context as you go.
 ## How to use it
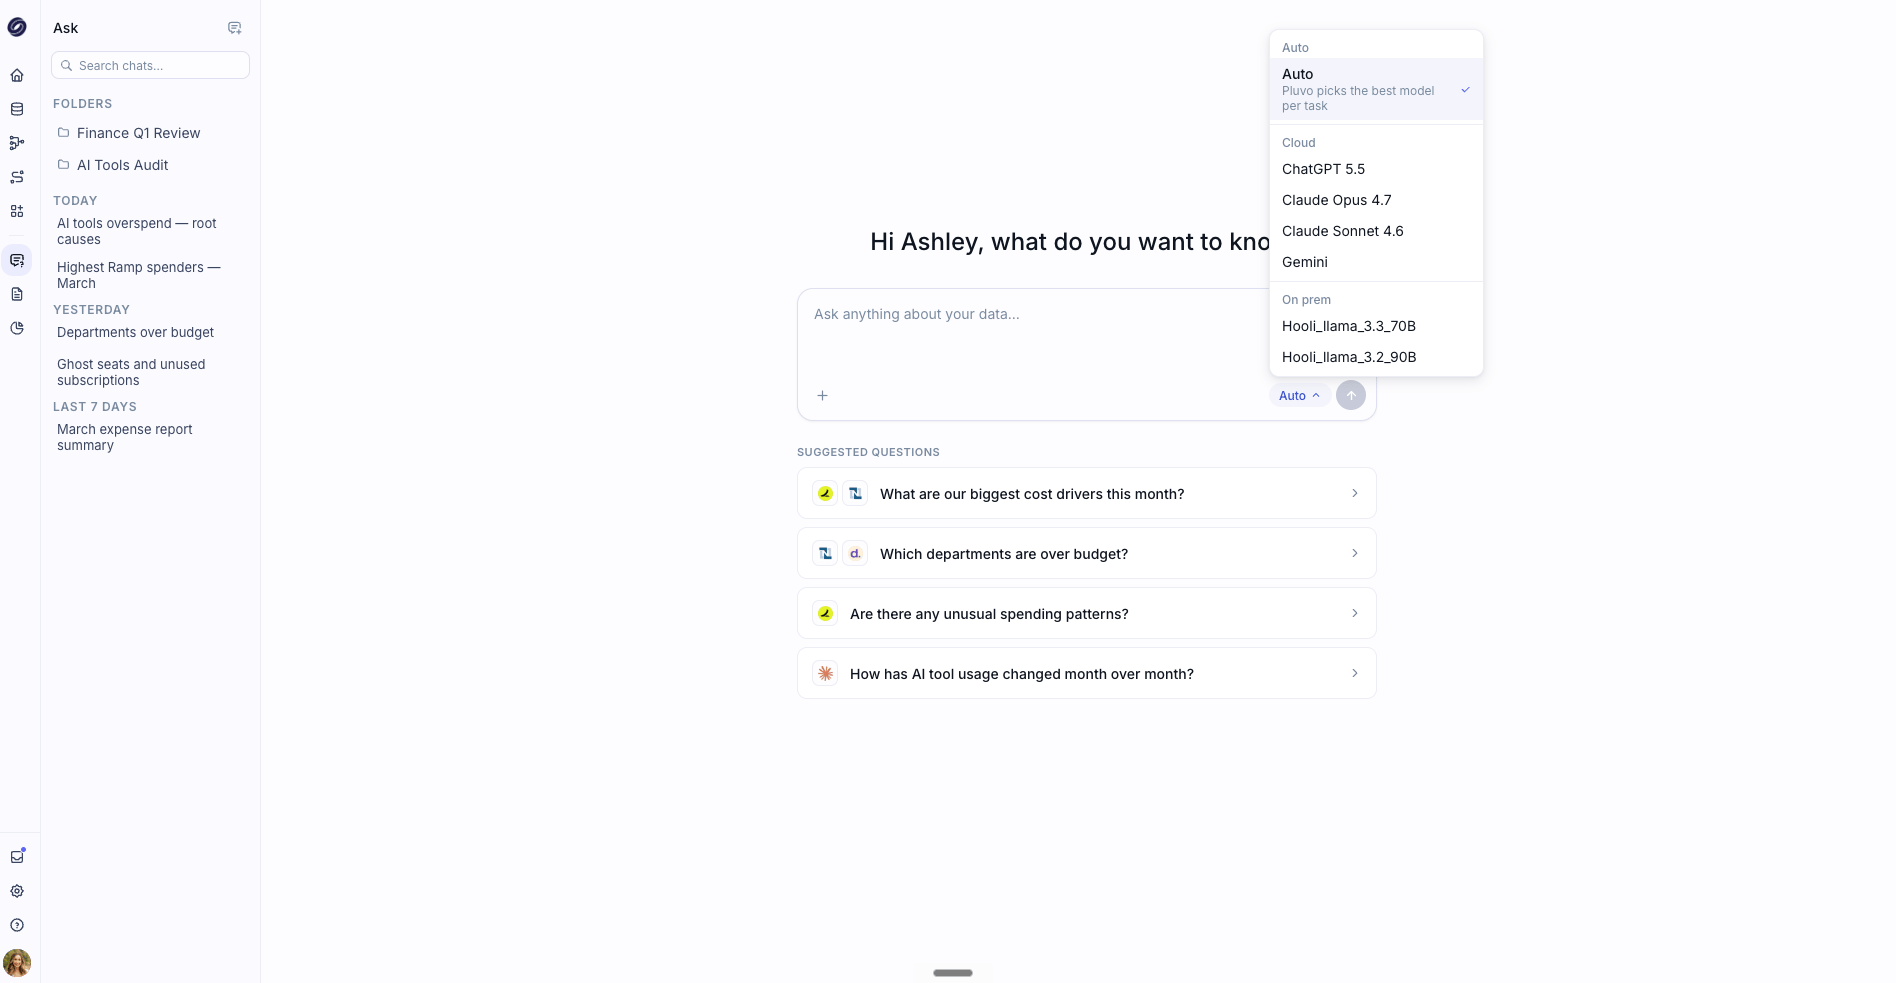
Type your question into the box, for example "Show revenue trends over the last 12 months" or "Why did expenses jump last quarter?"
Not sure where to begin? Pick one of the quick-start suggestions, such as **Variance analysis**, **Anomaly detection**, **Cash runway analysis**, or **Revenue trends**. Each one fills the box with a starting prompt you can edit before you send it.
Pluvo responds in the conversation with a written explanation and, where useful, charts and tables. You can follow the steps it took to reach the answer.
Ask a follow-up to go deeper, like "Break that down by department" or "Compare that to budget." Pluvo keeps the context of your conversation.
## Ask vs. Analyze
Ask and Analyze both answer questions about your data, but they suit different moments:
* **Ask** is fast and conversational. Use it for quick questions, exploring, and back-and-forth follow-ups.
* **Analyze** is structured and thorough. Use it when you want a full, planned investigation that produces a formal report.
If a quick question in Ask turns into something you want documented end to end, that is a good moment to move to **Analyze**.
## Tips
Be specific about the period and the metric you care about. "Compare Q4 actuals to forecast for marketing" gets you further than "how are we doing."
Ask answers from your existing data. For forward-looking "what if we changed X" questions, use Models, where scenarios live.
## How to use it
Type your question into the box, for example "Show revenue trends over the last 12 months" or "Why did expenses jump last quarter?"
Not sure where to begin? Pick one of the quick-start suggestions, such as **Variance analysis**, **Anomaly detection**, **Cash runway analysis**, or **Revenue trends**. Each one fills the box with a starting prompt you can edit before you send it.
Pluvo responds in the conversation with a written explanation and, where useful, charts and tables. You can follow the steps it took to reach the answer.
Ask a follow-up to go deeper, like "Break that down by department" or "Compare that to budget." Pluvo keeps the context of your conversation.
## Ask vs. Analyze
Ask and Analyze both answer questions about your data, but they suit different moments:
* **Ask** is fast and conversational. Use it for quick questions, exploring, and back-and-forth follow-ups.
* **Analyze** is structured and thorough. Use it when you want a full, planned investigation that produces a formal report.
If a quick question in Ask turns into something you want documented end to end, that is a good moment to move to **Analyze**.
## Tips
Be specific about the period and the metric you care about. "Compare Q4 actuals to forecast for marketing" gets you further than "how are we doing."
Ask answers from your existing data. For forward-looking "what if we changed X" questions, use Models, where scenarios live.